A free data analyst résumé example, and what makes its lines readable
One complete data analyst résumé, written out in full. The person is invented. The reading and the score come from the product itself.
— the tool list is the cheapest part of the page.
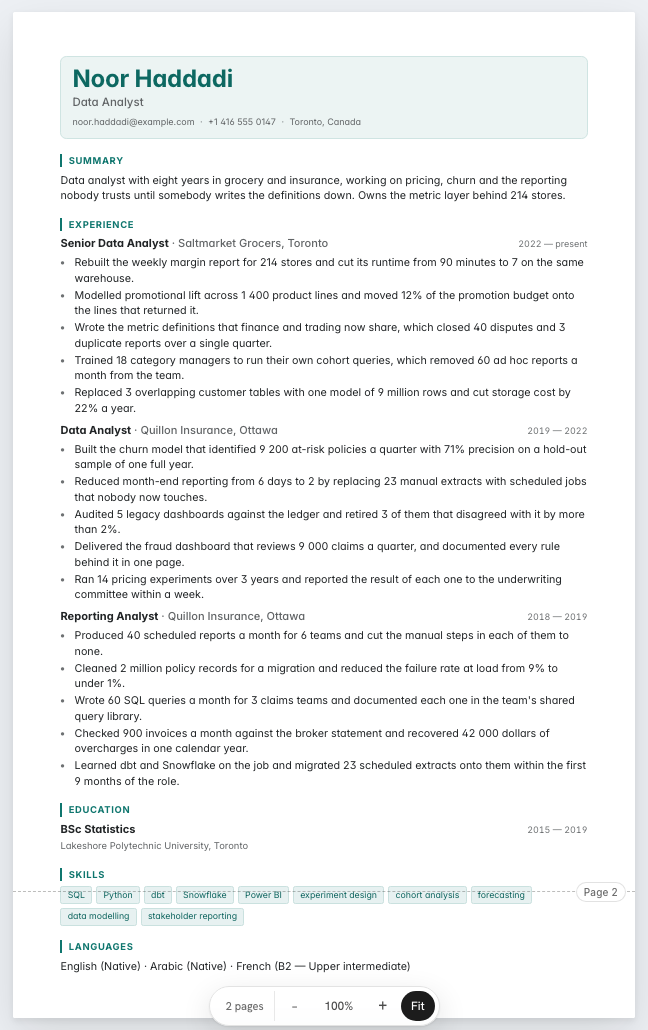
Analyst résumés fail in a particular way. They list the tools, they name the dashboards, and they never say what anybody did differently afterwards. This example is written out in full so you can read the lines, then put through the tools on this site so you can see what a parser takes from them. The candidate is invented.
The example, in full
An invented person. Not a real document, and not yours.
Noor Haddadi
Data Analyst
Toronto, Canada · [email protected] · +1 416 555 0147
Summary
Data analyst with eight years in grocery and insurance, working on pricing, churn and the reporting nobody trusts until somebody writes the definitions down. Owns the metric layer behind 214 stores.
Experience
Senior Data Analyst · Saltmarket Grocers, Toronto · 2022 to present
- Rebuilt the weekly margin report for 214 stores and cut its runtime from 90 minutes to 7 on the same warehouse.
- Modelled promotional lift across 1 400 product lines and moved 12% of the promotion budget onto the lines that returned it.
- Wrote the metric definitions that finance and trading now share, which closed 40 disputes and 3 duplicate reports over a single quarter.
- Trained 18 category managers to run their own cohort queries, which removed 60 ad hoc reports a month from the team.
- Replaced 3 overlapping customer tables with one model of 9 million rows and cut storage cost by 22% a year.
Data Analyst · Quillon Insurance, Ottawa · 2019 to 2022
- Built the churn model that identified 9 200 at-risk policies a quarter with 71% precision on a hold-out sample of one full year.
- Reduced month-end reporting from 6 days to 2 by replacing 23 manual extracts with scheduled jobs that nobody now touches.
- Audited 5 legacy dashboards against the ledger and retired 3 of them that disagreed with it by more than 2%.
- Delivered the fraud dashboard that reviews 9 000 claims a quarter, and documented every rule behind it in one page.
- Ran 14 pricing experiments over 3 years and reported the result of each one to the underwriting committee within a week.
Reporting Analyst · Quillon Insurance, Ottawa · 2018 to 2019
- Produced 40 scheduled reports a month for 6 teams and cut the manual steps in each of them to none.
- Cleaned 2 million policy records for a migration and reduced the failure rate at load from 9% to under 1%.
- Wrote 60 SQL queries a month for 3 claims teams and documented each one in the team's shared query library.
- Checked 900 invoices a month against the broker statement and recovered 42 000 dollars of overcharges in one calendar year.
- Learned dbt and Snowflake on the job and migrated 23 scheduled extracts onto them within the first 9 months of the role.
Education
BSc Statistics · Lakeshore Polytechnic University, Toronto · 2015 to 2019
Skills
SQL, Python, dbt, Snowflake, Power BI, experiment design, cohort analysis, forecasting, data modelling, stakeholder reporting
Languages
English · native · Arabic · native · French · B2
Every line ends in a decision
Read the fifteen achievement lines and notice what each one finishes with. A margin report whose runtime fell from 90 minutes to 7. Twelve per cent of a promotion budget moved to the lines that returned it. Forty recurring disputes closed by writing the metric definitions down. Three legacy dashboards retired because they disagreed with the ledger.
That is the difference between an analyst and a report writer, and it is entirely expressible on paper. The work itself was SQL, and SQL is in the skills list where it belongs. What belongs in the experience lines is the thing the SQL caused.
Where the tools go
Ten skills, one line, no proficiency bars. A skills bar chart carries no information a reader can use and it is one of the layout features most likely to be lost in extraction, along with tables and two-column sidebars. The checker's parseability rule takes twenty-two points off a document where it detects a table or a multi-column pattern, which is most of the gap between a scoring résumé and one that reads as empty.
The tools that matter are the ones named again inside an achievement line, where they are attached to an outcome. Snowflake and dbt sit in the skills row; the nine-million-row model they produced sits in the experience.
Skills for a data analyst résumé, grouped
Noor's skills fall into data, analysis and communication. Data: SQL, Python, dbt, Snowflake, data modelling. Analysis: experiment design, cohort analysis, forecasting. Communication: Power BI, stakeholder reporting. An analytics manager reads the analysis group as the proof you answer questions, not only query tables.
Analysts in finance or product add their domain as a group of its own. Groups can be renamed or dropped in the free résumé builder at any time.
From reporting analyst to senior data analyst
A reporting analyst's résumé proves reliable delivery: reports automated, figures reconciled, a dashboard kept current. The Quillon roles start there. A data analyst adds questions answered and decisions changed.
A senior analyst adds experiments, models and influence: tests designed, forecasts used in planning, analysts coached. End every line in a decision. The keywords guide covers how tool names are read.
How it reads and scores
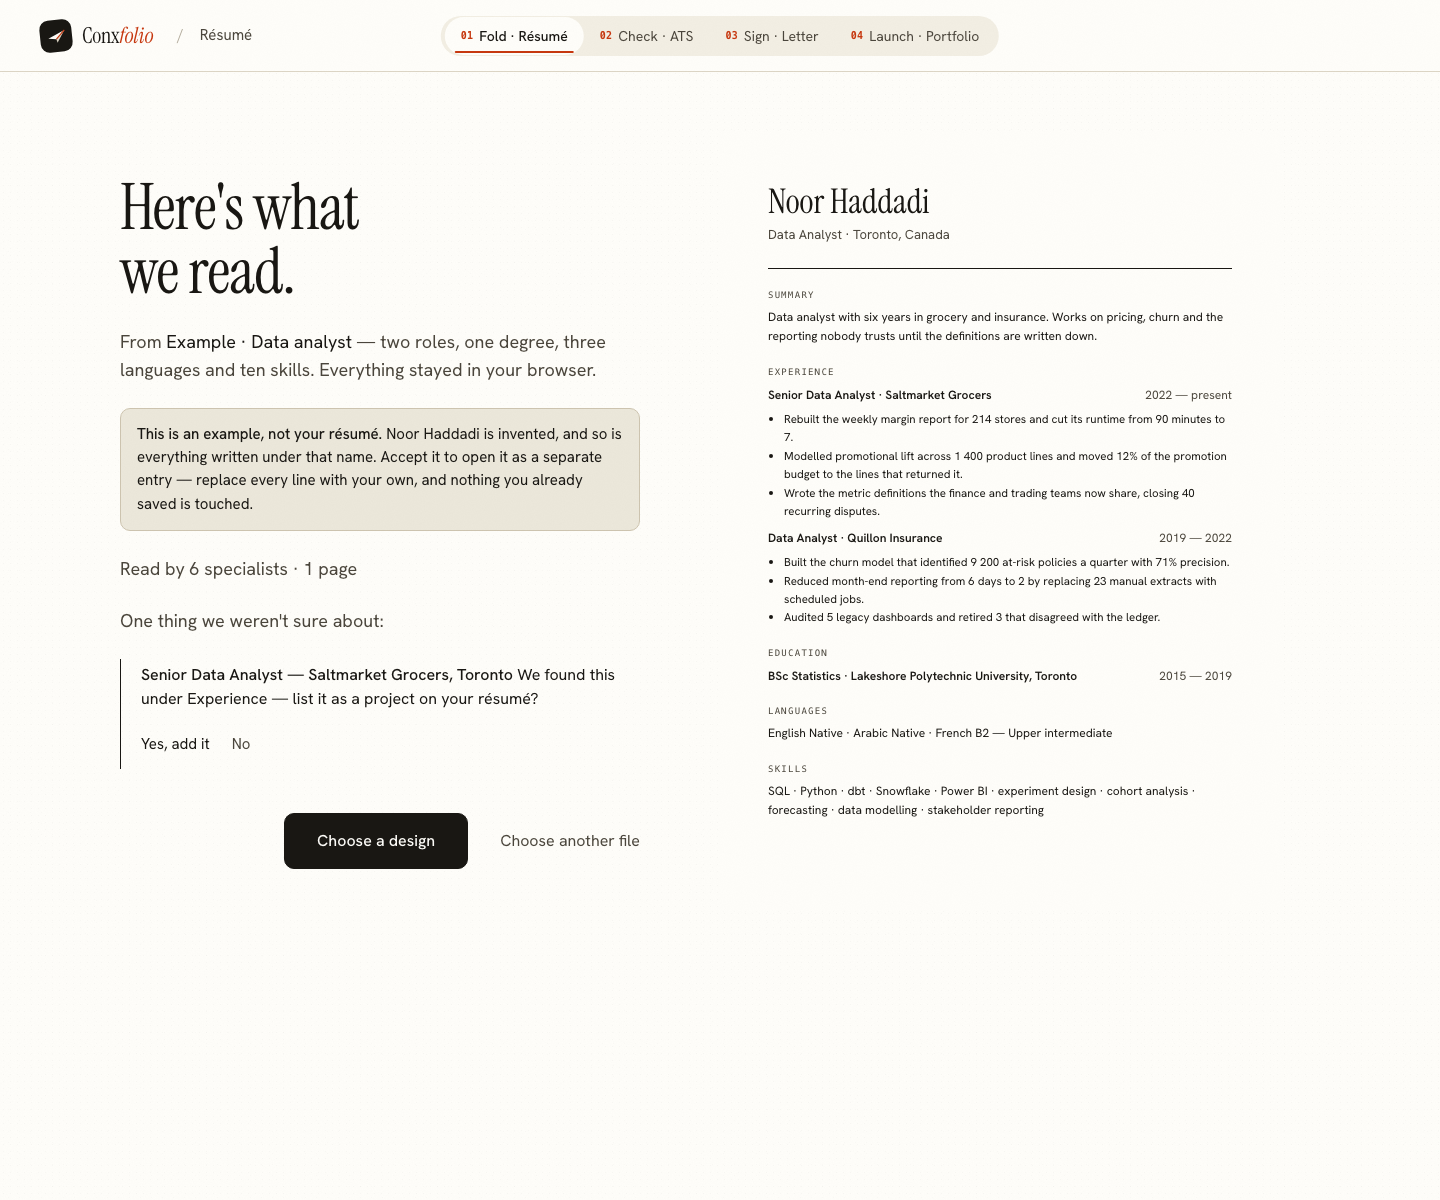
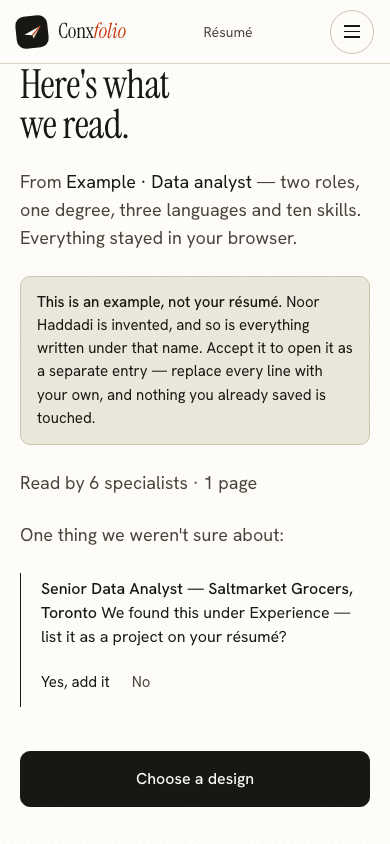
The import review reads 3 roles, 1 degree, 3 languages and 10 skills before anything reaches the editor. Here the reading found three dated roles with five achievement lines under each, one degree, ten distinct skills and three languages, and no certifications, because the document carries none. The ATS checker scored it 98 out of 100, re-measured on 25 September 2026, with readable volume 3 points short and achievement quality 1 point short. The writing check scored it 95, which is 91 of the 96 points that applied here, and the five it did not award are one check: bullet tense. How our examples are made explains the import review and the scoring behind these figures.
What to change for your own
Start with the domain nouns. Pricing, churn, claims, supply and marketing analytics all use this shape with different vocabulary, and a posting will tell you which words it wants. Then check every line for its ending: if a line stops at the deliverable, finish it with the decision.
Keep the skills row short and honest, following the guide on the skills section. Keep the languages if you have them. The design gallery holds 37 layouts, 24 of them marked ATS-safe. For the same structure in other work, read the student example, the nurse example and the project manager example.
Write yours beside it
Opens the builder with Noor's example loaded, saved as its own entry in the Nexus design. Replace every line with your own. Free, no account.
Use this exampleCheck a résumé insteadQuestions
- Is Noor Haddadi a real analyst
- No. She is invented for this page, and so are Saltmarket Grocers and Quillon Insurance. The figures demonstrate a shape and describe nobody's career.
- Why is the skills list only ten items
- Because a list of thirty tools is read as a list of thirty things you have opened once. Ten is enough to match a posting and short enough that a person reads all of it. The reading counted ten distinct skill entries here.
- Do model metrics belong in a résumé line
- A precision or recall figure belongs there if you can explain how it was measured. The example says 9 200 at-risk policies a quarter at 71% precision, which is a claim an interviewer can open up, and that is the test.
- What did the checker score it
- 98 out of 100, re-measured on 25 September 2026, with readable volume 3 points short and achievement quality 1 point short. The arithmetic is 100 × 30% for parseability + 100 × 30% for completeness + 96 × 40% for content, on 413 readable words. The writing check beside it scored 95, which is 91 of the 96 points that applied.
- Should I list dashboards I built
- List what changed because of them. The example names a report whose runtime fell from 90 minutes to 7 and three dashboards audited with three retired, which says more about judgement than a count of dashboards would.
- Which design is this rendered in
- Nexus, one of the eight layouts in the ATS family and one of the 24 ATS-safe designs out of 37. The page named Gridline until the document was moved on 2026-09-14. The eight were chosen from a measurement taken that day: each exports a PDF whose text layer scores exactly what the pasted text scores, on both test documents, in one column, with the reading order kept and no graphics.
Conxfolio is a free set of four career tools: a résumé builder with 37 rendered layouts, an ATS résumé checker that prints its own arithmetic, a cover letter builder that traces every proof paragraph back to the line it came from, and a portfolio builder with 22 authored designs. There is no account to create, nothing is held back for a paid plan, and no language model is used anywhere in the product, so the readers, the score and the letter are deterministic code you can check.